Instruments Help Chinese Translation
Instruments Chinese Guide
#InstrumentsHelp
About Instruments
Instruments Overview
Instruments is a powerful and flexible performance-analysis and testing tool that’s part of the Xcode tool set. It’s designed to help you profile your iOS, watchOS, tvOS, and macOS apps, processes, and devices in order to better understand and optimize their behavior and performance. Incorporating Instruments into your workflow from the beginning of the app development process can save you time later by helping you find issues early in the development cycle.
profile: an analysis (often in graphical form) representing the extent to which something exhibits various characteristics An analysis (usually in graphical form) of the extent to which something exhibits different characteristics
Instruments is a powerful and flexible performance analysis and testing tool that is part of the Xcode toolset. It is designed to help you analyze your iOS, watchOS, tvOS and macOS applications, processes and devices to better understand and optimize their behavior and performance. Incorporating tools into your workflow from the very beginning of the application development process can help you catch problems early in development, saving you time.
In Instruments, you use specialized tools, known as instruments, to trace different aspects of your apps, processes, and devices over time. Instruments collects data as it profiles, and presents the results to you in detail for analysis. In Instruments, you use specialized tools (Instruments) to track problems with different aspects of applications, processes, and devices. Instruments collects data for analysis, and then displays the analysis results to you in the form of charts so that you can conduct detailed analysis.
Unlike other performance and debugging tools, Instruments allows you to gather widely disparate types of data and view them side by side. This makes it easier to identify trends that might otherwise be overlooked. For example, your app may exhibit large memory growth caused by multiple open network connections. By using the Allocations and Connections instruments together, you can identify connections that are not closing and thus resulting in rapid memory growth.
Unlike other performance and debugging tools, Instruments enables you to collect widely different types of data and view them side by side. This makes it easier to identify trends that may have been overlooked. For example, your application may experience large memory growth due to multiple network connections being opened. By using the Allocations and Connections tools together, you can identify connections that are not closed and thus find the cause of rapid memory growth.
By using Instruments effectively, you can: To use Instruments effectively, you can do this:
-
Examine the behavior of one or more apps or processes Check the behavior of one or more applications or processes
-
Examine device-specific features, such as Wi-Fi and Bluetooth Check the characteristics of specific devices, such as Wi-Fi and Bluetooth
-
Perform profiling in a simulator or on a physical device Performance analysis on simulator or physical device
-
Track down problems in your source code Track issues in source code
-
Conduct performance analysis on your app Performance analysis of applications
-
Find memory problems in your app, such as leaks, abandoned memory, and zombies Discover memory issues in your application, such as memory leaks and zombie objects
-
Identify ways to optimize your app for greater power efficiency Find out how to optimize your applications for greater power efficiency
-
Perform general system-level troubleshooting Perform general system-level troubleshooting
-
Save instrument configurations as templates Save instrument configuration as template
-
Although it’s embedded within and may be used with Xcode, Instruments is a separate app, which may be used independently as needed. Although Instruments is built-in and used with Xcode, Instruments is a standalone application and can be used independently as needed.
About the trace document About the trace document.
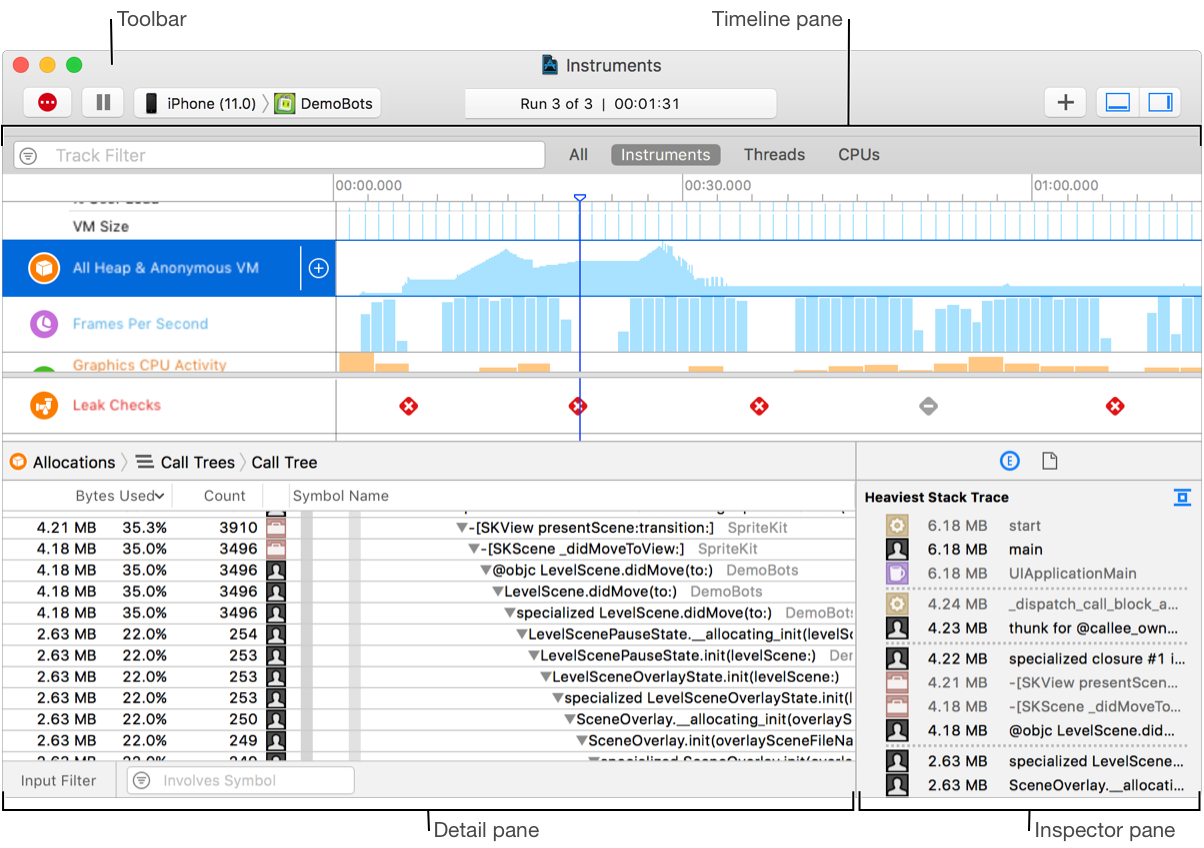
A trace document is used to organize and configure instruments for profiling, initiate data collection, and view and analyze the results. You create a new trace document by launching Instruments and choosing a profiling template or by initiating profiling from Xcode, the Dock, or the command line. You can also save and reopen trace documents in which you’ve configured instruments and collected data.
Trace documents are used to organize and configure the instruments environment for analysis, initialize data collection, and view and analyze results. You can create a new trace document by launching Instruments and selecting a profiling template, or by launching profiling through Xcode, the Dock, or the command line. You can also save and reopen configured Instruments environments and collected trace document data. Trace documents can contain a lot of very detailed information, which is presented through many panes and areas.
About the trace document toolbar.
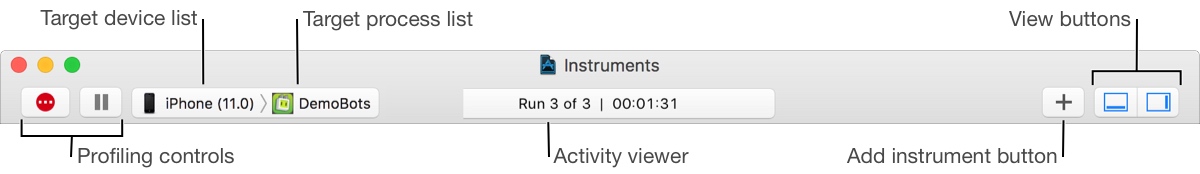
The toolbar of the trace document lets you start, pause, and stop data profiling, add instruments, hide and show panes, and more. The tracking document’s toolbar allows you to start, pause, and stop data analysis, add analysis tools, hide and show panes, and more.
The toolbar includes the following main elements: The toolbar consists of the following main elements:
-
Profiling controls: Allow you to record, pause, and stop data collection.
-
Target device list: Allows you to select the device on which you wish to profile.
-
Target process list: Allows you to select the process or processes to profile. Allows you to select the application to profile.* Activity viewer: Shows the number of runs for the trace document and the elapsed time of the current trace.
-
Add Instrument button (+): Shows or hides the instruments Library palette, which contains a complete list of available instruments. From here, you can select individual tools and add them to the tracking document.
-
View buttons (
 ): Hide or show the detail pane and inspector. Hide or show the detail pane and inspector.
About the trace document timeline pane Trace document timeline pane
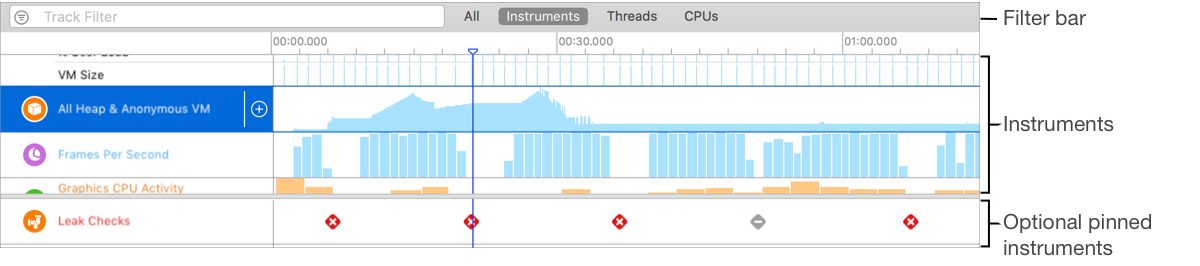
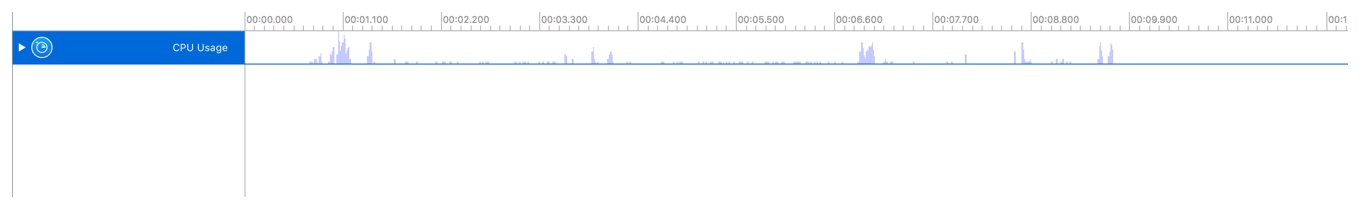
The timeline pane displays a graphical summary of the data recorded for a given trace. In this pane, each instrument, CPU core, or thread has its own “track,” which provides a graphical chart of the data collected. The Timeline pane displays a graphical summary of the data recorded for a given trace. In this pane, each instrument, CPU core, or thread has its own “track,” which provides a graphical chart of the collected data.
Although this pane’s information is read-only, you can scroll through data, select specific areas for closer examination, and insert flags to highlight points of interest. You can change how graphical information is displayed here by adjusting the zoom level or by changing the display settings of individual instruments using the display configuration popover. An optional filter bar provides controls for filtering the data displayed by an instrument. For example, the Sampler instrument can filter the data by thread. Although the information in this pane is read-only, you can scroll through the data, select specific areas for closer inspection, and insert markers to highlight points of interest. You can change how graphical information is displayed here by adjusting the zoom level or changing the display settings for individual instruments using the display configuration popup. The optional filter bar provides controls for filtering the data displayed by the instrument. For example, a sampler can filter data through threads.
You can pin timelines to the bottom of the pane to keep important information visible as you investigate issues. For example, you can pin the Leaks instrument to the bottom of the pane, and then scroll through the other instruments to find the possible causes for a leak. Pinned instruments are not preserved between runs. You can pin the timeline to the bottom of the pane to keep important information visible while researching an issue. For example, you can pin the leak tool to the bottom of the pane and scroll through other tools to find possible causes of leaks. Fixed instruments cannot be saved between runs.
Strategy views View strategy
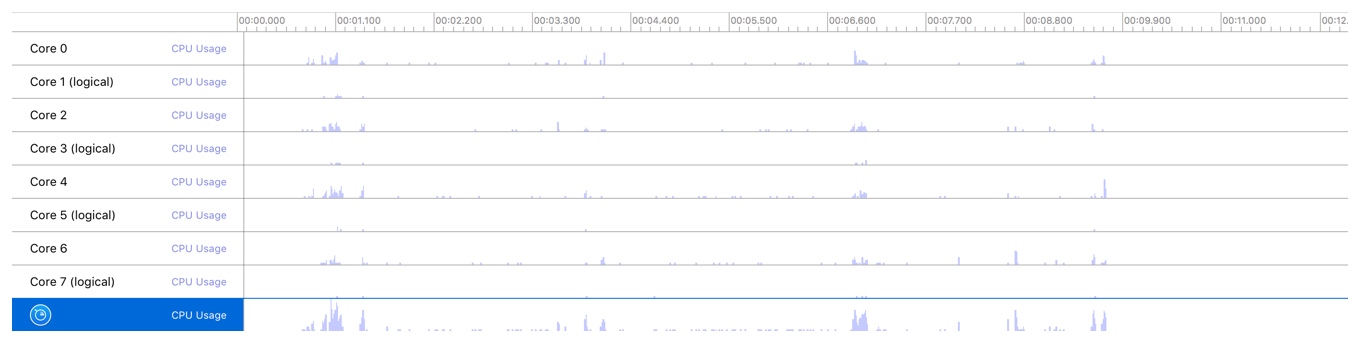
Click the strategy buttons in the filter bar to display instruments, CPU core, thread data, or all three items in the timeline. Click the policy button in the filter bar to display instruments, CPU cores, thread data, or all three items in the timeline.

All: Show data for instruments, threads, and CPUs in the timeline. All: Display instruments, threads, and CPUs in the timeline.
CPUs: Displays a list of CPU cores, along with their usage over time, in the timeline pane. Only available when a trace document contains instruments that record CPU data. CPUs: Displays a list of CPU cores and their usage over time in the timeline pane. Available only if the trace document contains tools that log CPU data.
Instruments: Displays a list of instruments and their corresponding data in the timeline pane. Instruments: Displays a list of tools and their corresponding data in the Timeline pane.
If you select an instrument in the list, you can delete it or configure it in the inspector pane. The instruments list is visible by default when you create a trace document. If you select a tool in the list, you can delete it or configure it in the inspector pane. When creating a trace document, the instruments list is visible by default.
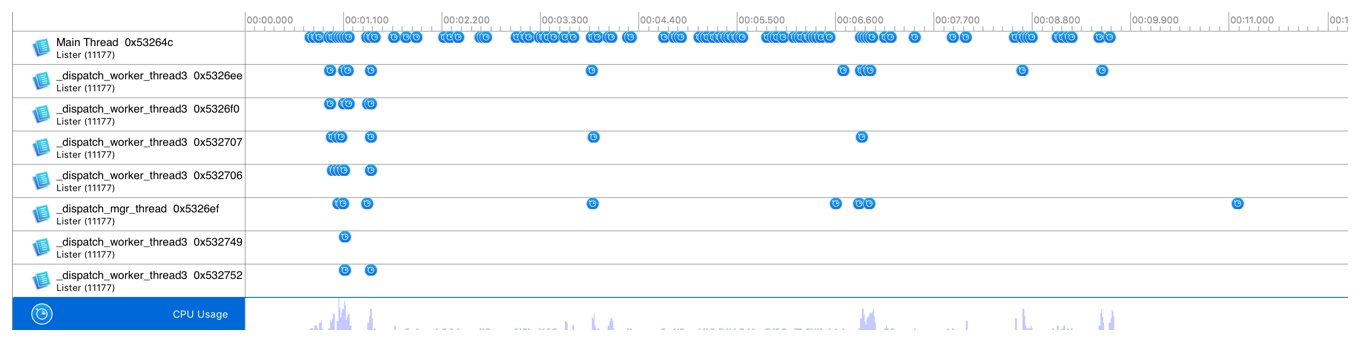
Threads: Displays a list of threads and their utilization data in the timeline pane. Only available when a trace document contains instruments that record thread data. Threads: Displays a list of threads and their utilization data in the timeline pane. Available only if the trace document contains facilities for recording thread data.
About the display configuration popover About the pop-up configuration interface
Use the display configuration popover to configure what data is displayed in the timeline and to configure the format of the displayed data. Use [pop-up configuration interface] (https://help.apple.com/instruments/mac/current/#/deva13e2923b) to configure the data displayed in the timeline and the format of the displayed data.
The settings available in the display configuration popover vary, depending on the instrument. These settings can help you: Depending on the tool selected, the settings available in the pop-up configuration interface are different. These settings can help you:
-
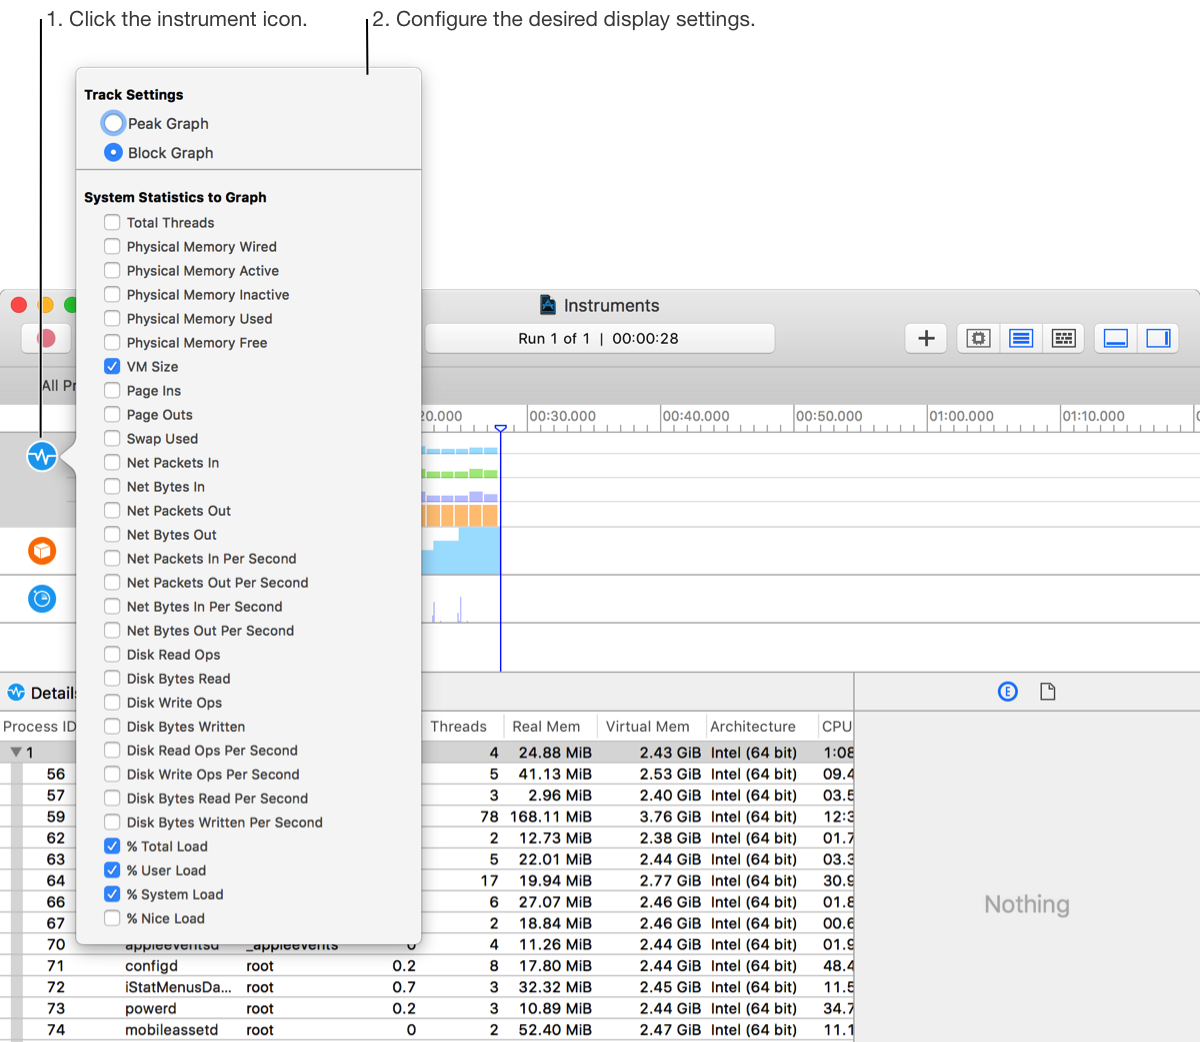
Control the data that appears in the timeline. For example, the Activity instrument allows you to toggle the display of total threads, VM size, and several other system statistics. Control what data appears on the timeline. For example, the Activity tool allows you to toggle the display of total threads, VM size, and some other system statistics.
-
Adjust how recorded information is represented in the timeline view. For example, an instrument may allow you to switch between a peak graph and a block graph. Adjust how recording information is represented in the Timeline view. For example, one tool lets you switch between peak plots and block plots.To open the popover, click the instrument icon in the trace document timeline pane. Instruments that support a display configuration popover show an indicator when the pointer is moved over the icon. To open the configuration interface, click the tool icon in the Track Document Timeline pane. Tools that support displaying the configuration interface display an indicator when the pointer moves over the icon.
About the trace document detail pane About the trace document detail pane
The detail pane shows detailed information about the data collected by the instruments in your trace document. Select an individual instrument in the timeline pane to see the data it collected while profiling. The Details pane displays details of the data collected by the tool in the tracking document. Select an individual tool in the Timeline pane to view the data it collected while analyzing.
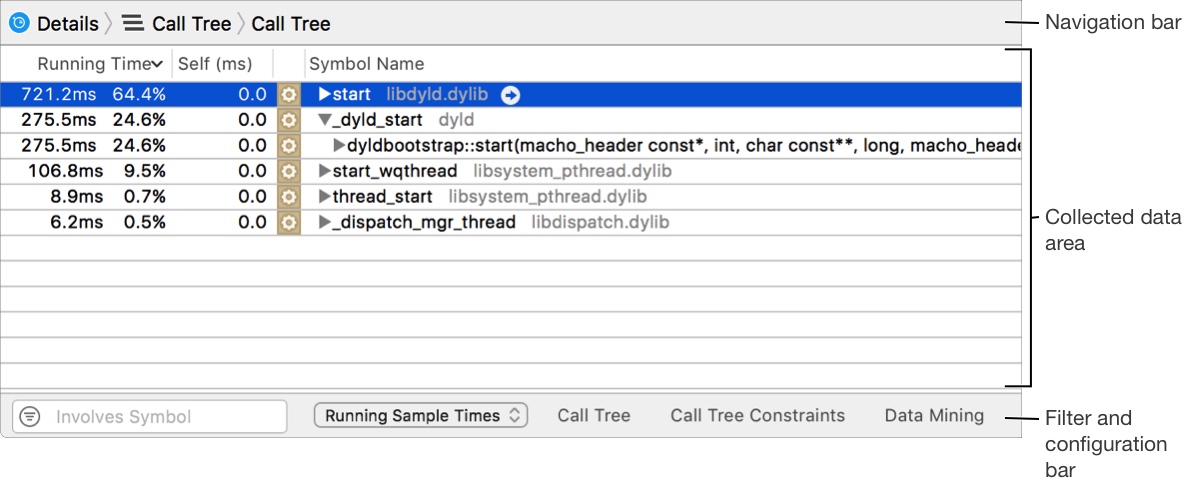
The detail pane consists of three main areas, the navigation bar, the collected data area, and the filter and configuration bar. The details pane consists of three main areas: navigation bar, collected data area, filters, and configuration bar.
Navigation bar
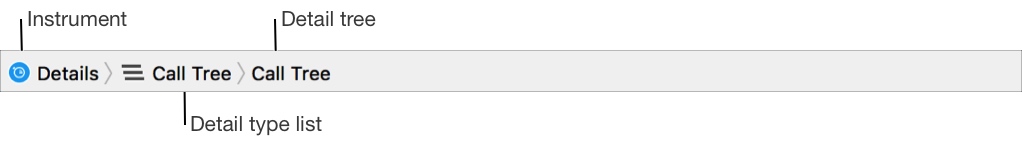
The navigation bar at the top of the detail pane helps you browse through collected data. The navigation bar at the top of the details pane helps you navigate the collected data.
You can use the navigation bar to switch between types of data and to navigate through different levels of data. You can use the navigation bar to switch between different types of data and navigate between different levels of data.
-
Instrument: Icon of the currently selected instrument in the timeline pane. Click this to view the console for the instrument. Instrument: The icon for the currently selected instrument in the Timeline pane. Click here to view the instrument’s console.
-
Detail type list: Allows you to navigate between different types of data. The options displayed here vary, depending on the actively selected instrument. For many instruments, the list includes things like a summary of data, a call tree, and a console. Detail type list: Allows you to navigate between different types of data. The options shown here vary depending on the tool selected. For most tools, the list includes a summary of data, a call tree, and a console.
-
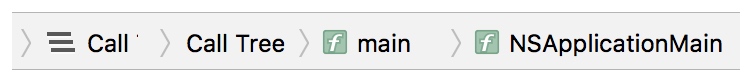
Detail tree: Keep track of where you are in the hierarchy as you navigate through the data in the detail pane. Click a branch of the tree to move back up the hierarchy to the corresponding data. Detail tree: When browsing data in the details pane, keep track of where you are in the hierarchy. Click a branch of the tree to move up the hierarchy of the corresponding data.
Collected data area Data collection area
The collected data area shows you all of the data for the selected instrument, typically in tabular format. The content displayed here varies significantly from instrument to instrument. For example, the Activity Monitor instrument displays process, CPU, and thread information, and much more. The data collection area displays all data for the selected tool, usually in a tabular format. What is shown here varies depending on the tool used. For example, the Activity Monitor tool displays process, CPU and thread information, and more.
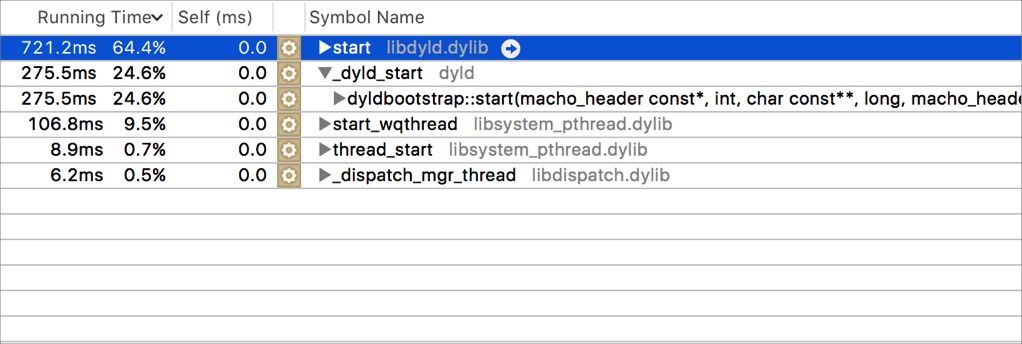
Often, individual symbols and data points within this area contain navigation buttons  , which appear when you move your pointer over them. You can click these buttons to move deeper into the data. As you do, the detail tree in the navigation bar updates to reflect where you are in the hierarchy.
Typically, individual symbols and data points within this area contain navigation buttons , which appear when you move the pointer over these buttons. You can click these buttons to drill down into the data. As you do, the details tree in the navigation bar will update to reflect your position in the hierarchy.
, which appear when you move your pointer over them. You can click these buttons to move deeper into the data. As you do, the detail tree in the navigation bar updates to reflect where you are in the hierarchy.
Typically, individual symbols and data points within this area contain navigation buttons , which appear when you move the pointer over these buttons. You can click these buttons to drill down into the data. As you do, the details tree in the navigation bar will update to reflect your position in the hierarchy.
Filter and configuration bar Filter and configuration bar
The filter and configuration bar at the bottom of the detail pane helps you filter the collected data and configure how that data is displayed. The filter and configuration bar at the bottom of the details pane helps you filter the collected data and configure how the data is displayed.
-
Filter field: Allows you to filter collected data for a specific term. Click the filter field’s menu for some additional filtering options. You can also filter collected data more extensively by adjusting display settings in the display configuration popover. Filter field: Allows you to filter collected data for specific terms. Click the filter field’s menu for some additional filtering options. You can also filter the collected data more extensively by adjusting the display settings in display configuration popover.
-
Display configuration controls: Refine the displayed results by filtering, sorting, and data mining. The controls vary from instrument to instrument and can include menus for selecting different views of the results, and popovers for constraining the data that is shown. Display configuration controls: Refine displayed results through filtering, sorting, and data mining. Controls vary from instrument to instrument and can include menus for selecting different views of the results, as well as pop-ups for constraining the data displayed.

About the trace document inspector pane About the trace document inspector pane
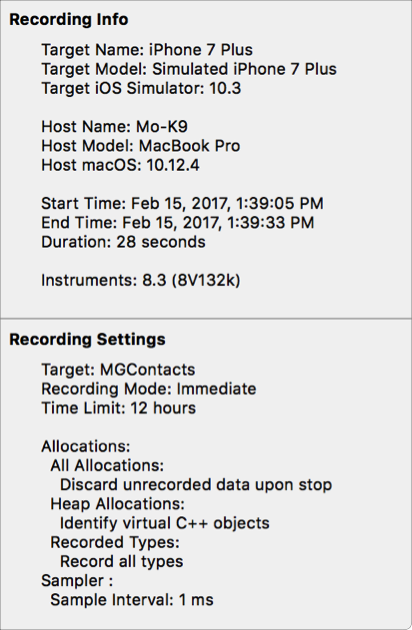
The inspector pane contains information about the run that’s currently displayed in the detail pane. It includes information about the recording and, for some instruments, additional details about the selected data. The inspector pane contains information about the run currently displayed in the details pane. It includes information about the recording and, for some instruments, additional details about the selected data.
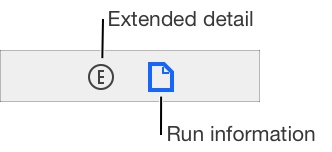
Run information area Run information areaThe run information area shows information about the run displayed in the detail pane including the target, recording time, and the settings used for the recording. The run information area displays the run information shown in the details pane, including the target, recording time, and settings used by the recording.
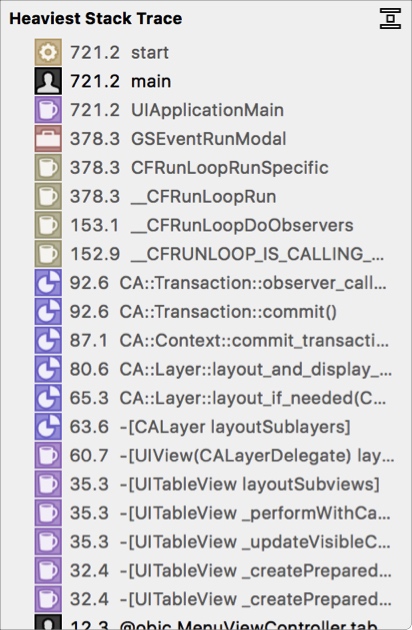
Extended detail area Extended detail area
The extended detail area is used to display additional instrument-specific information about selected data in the detail pane, such as a complete stack trace. The extended details area is used to display additional tool-specific information about the selected data in the details pane, such as a full stack trace.
About the Library palette About the Library palette
The Library palette provides a complete list of available instruments and lets you add them to your trace documents. Here, you can browse instrument descriptions and filter for a specific instrument. The Library palette provides a comprehensive list of available tools and allows you to add them to tracking documents. Here you can browse instrument descriptions and filter for specific instruments.
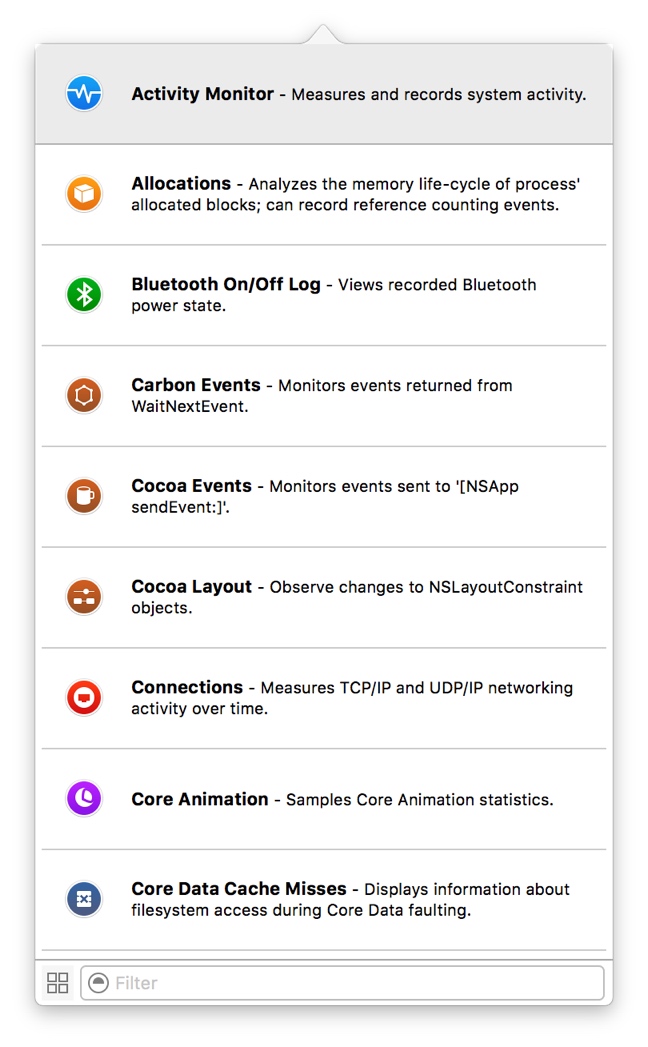
To display the Library palette, choose Window > Library, press Command-L, or click the Add Instrument button (+) in the trace document toolbar. To display the Library palette, select Window>Library, press Command-L, or click the Add Instrument (+) button in the Trace Document toolbar.
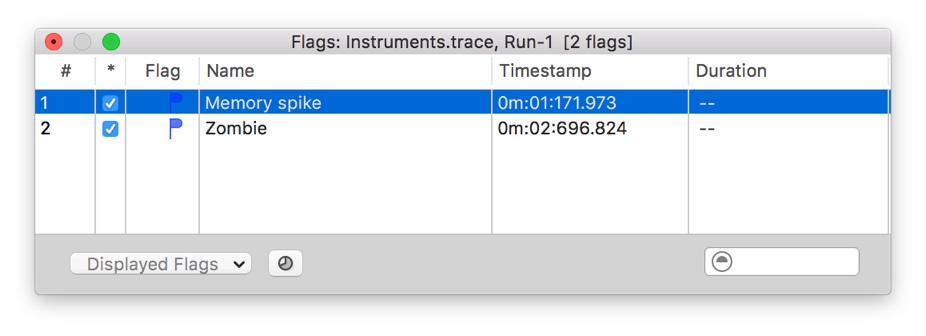
About the Flags palette About the Flags palette
The Flags palette displays a list of any flags you may have applied in the timeline pane of the active trace document. The Flags palette displays a list of any flags you may have applied in the Timeline pane of the activity tracking document.
In the Flags palette, you can select a flag to quickly navigate to it in the timeline. You can also filter through a large list of flags for a specific one, show and hide your flags, and view timestamp information about your flags. In the Flags panel, you can select a flag to quickly navigate to it in the timeline. You can also filter through a large list of specific flags, show and hide your flags, and view timestamp information about your flags.
About profiling templates About profiling templates
In Instruments, you use profiling templates to analyze your app. A profiling template is a trace document that has been preconfigured with instruments and settings for performing a common type of trace. Configuration templates are used in Instruments to analyze applications. A configuration template is a tracing document that is preconfigured with tools and settings for performing common types of tracing.
Profiling templates are available when you launch Instruments, create a new document, or initiate a trace from Xcode. You can also create your own templates if you have more advanced or custom needs. Analysis templates can be used when launching tools, creating new documents, or initiating traces from Xcode. You can also create your own template if you have more advanced or custom needs.
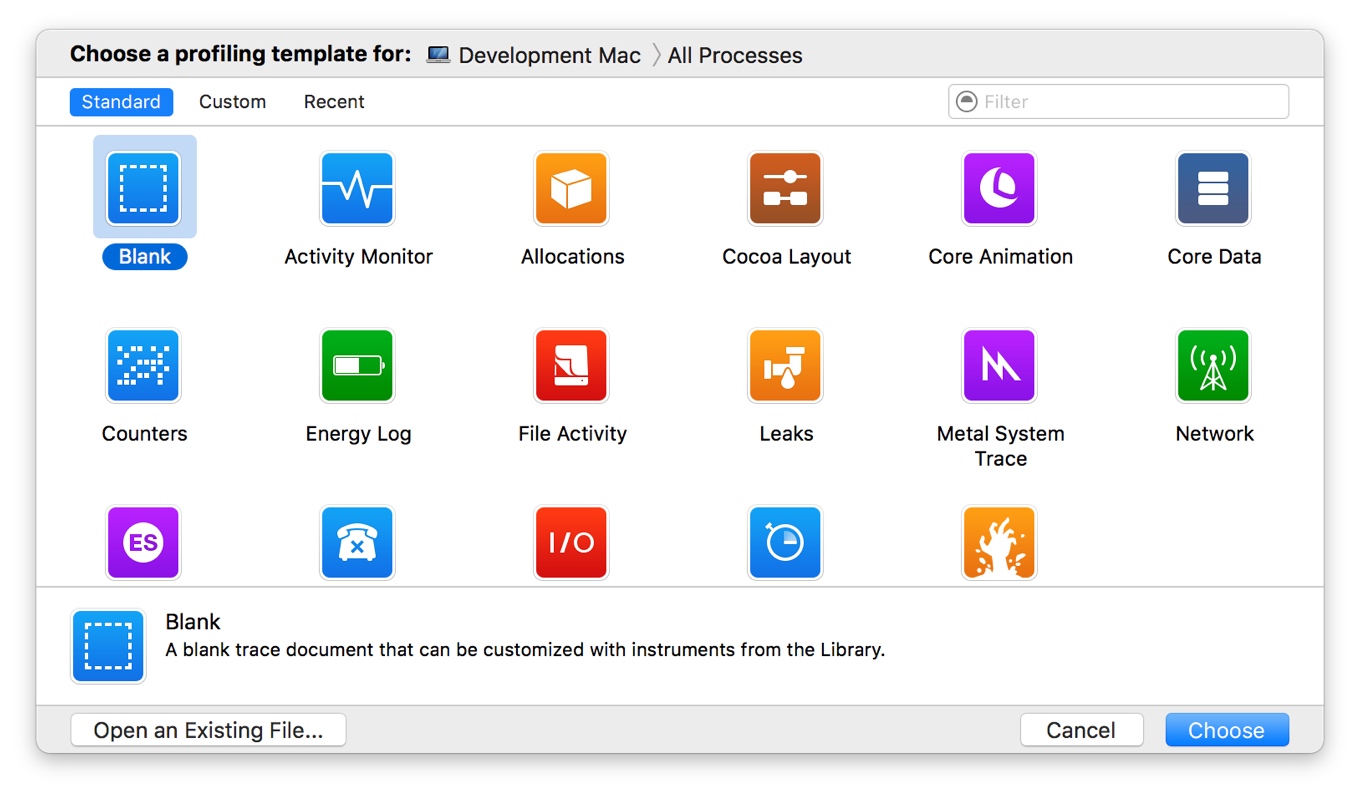
About the profiling template selection dialog About the profiling template selection dialog
When Instruments launches, you’re presented with a list of profiling templates—files containing sets of preconfigured instruments—from which to choose. This list includes a set of standard templates as well as any custom templates you may have created. When the tool launches, you’ll see a list of analysis templates—files containing preconfigured toolsets—to choose from. This list includes a set of standard templates as well as any custom templates you might create.
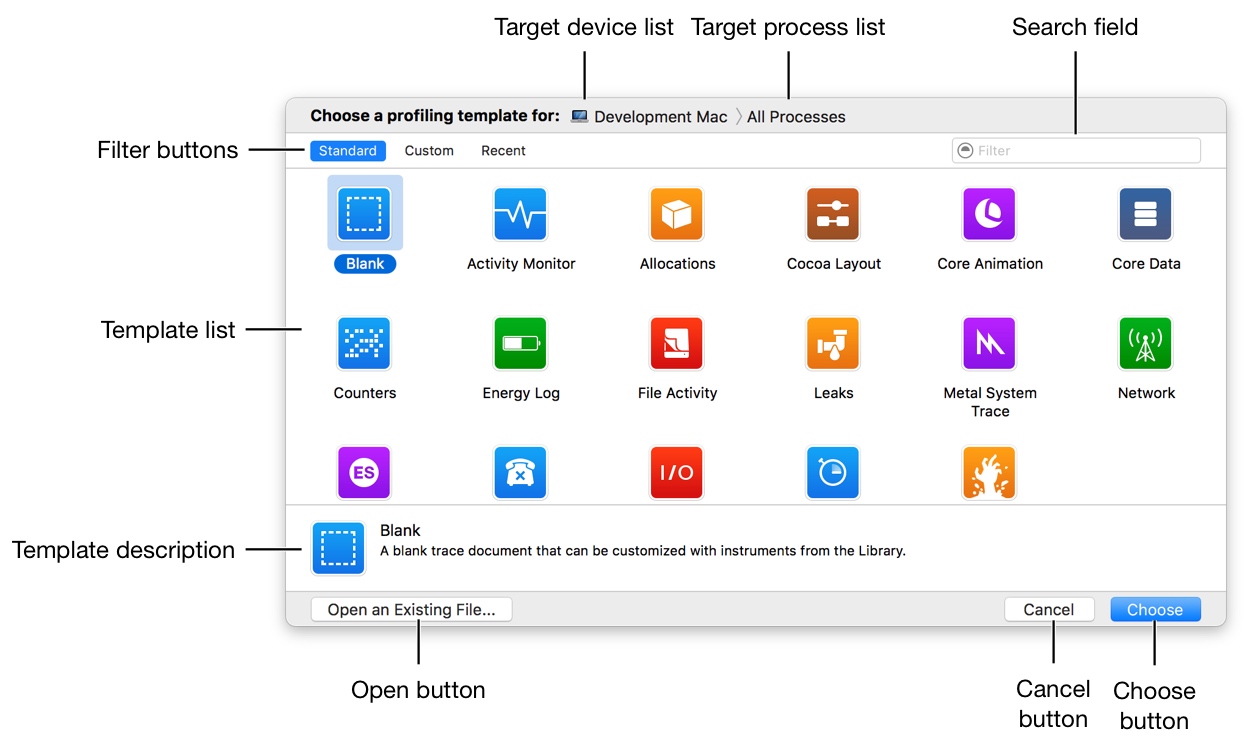
The profiling template selection dialog consists of the following primary elements. The Analysis Template Selection dialog box consists of the following main elements.
-
Target device list: Click this to select the device on which you wish to profile. Target device list: Click this to select the device to profile.
-
Target process list: Click this to select the process or processes to profile. Target process list: Click this option to select a process or processes to configure.
-
Filter buttons: Click these to filter down the list of templates to display just the standard templates, custom templates, or recently used templates. Filter buttons: Click these options to filter the template list to show standard templates, custom templates, or recently used templates.
-
Search field: Enter some text to quickly find the template you need. This searches template titles and descriptions. Search field: Enter some text to quickly find the template you want. Search template title and description.
-
Template list: The list of profiling templates, which may be filtered if you clicked a filter button or entered search criteria. Template list: Configure the template list, which may be filtered if you click the filter button or enter search criteria.
-
Template description: A short description of the currently selected profiling template, which can be helpful for determining whether the selected template meets your needs. Template description: A brief description of the currently selected analysis template, which can help determine whether the selected template meets your needs.
-
Choose button: Click this to create a new profile document, based on the currently selected template. Choose button: Click here to create a new profile based on the currently selected template.
This button changes to Profile when you press the Option key. Click the Profile button to create a new document based on the currently selected template and immediately begin profiling the target process.
- Open button: Click this to open a previously saved profile document, rather than starting with a fresh template. Open button: Click here to open a previously saved profile instead of starting from a new template.* Cancel button: Click this to close the template selection dialog. Cancel button: Click this to close the template selection dialog box.
Note: You can display profiling template selection dialog at any time by choosing File > New (or pressing Command-N). Note: You can display the Analysis Template Selection dialog box at any time by selecting File > New (or pressing Command-N).
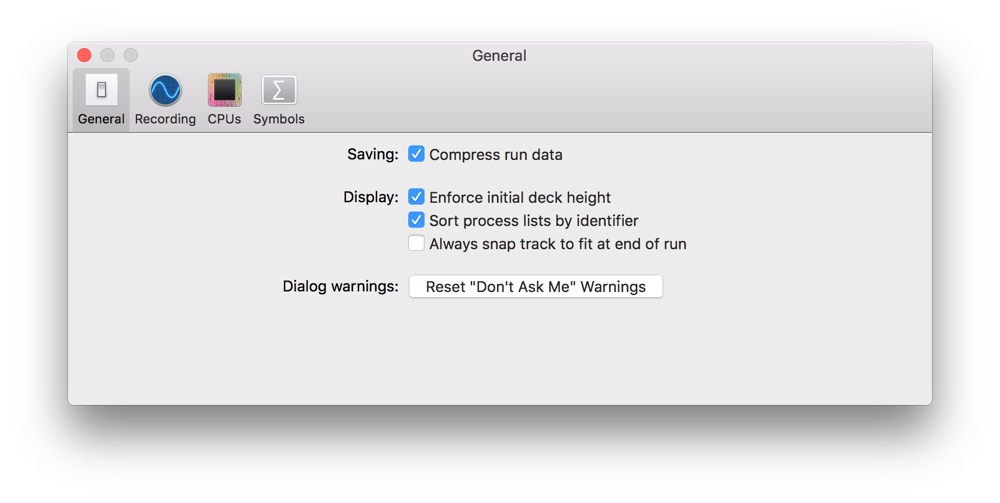
About the Preferences window About the Preferences window
The preferences window is used to control various settings related to the behavior of Instruments. The preferences window is used to control various settings related to instrument behavior.
In the preferences window, you can adjust general settings that pertain to startup, saving, and more. You can also adjust recording settings, CPU settings, and symbol preferences. In the preferences window, you can adjust general settings related to startup, saving, etc. You can also adjust recording settings, CPU settings, and symbol preferences.
What to read next
Want more posts about Instruments?
Posts in the same category are usually the best next step for reading more on this topic.
View same categoryWant to keep following #Xcode?
Tags are useful for related tools, specific problems, and similar troubleshooting notes.
View same tagWant to explore another direction?
If you are not sure what to read next, return to the homepage and start from categories, topics, or latest updates.
Back home